Every major launch vehicle company publishes a publicly available flight schedule — a ranked, time-ordered list of every mission they expect to fly for paying customers. It is called a launch manifest. It is completely free to access. And the overwhelming majority of retail investors who hold positions in Rocket Lab, Boeing, or any space-adjacent name have never looked at one.
That is a meaningful information asymmetry. The launch manifest is, in effect, a forward-looking balance sheet. It tells you who the customers are, how full the order book is, how fast the rocket is flying, and how confident — or desperate — the provider is about pricing. When you understand what you are reading, it gives you revenue signals that will not appear in an earnings report for six to eighteen months.
This guide explains exactly how to find manifests, what data lives inside them, and how to extract actionable signals for your investment thesis. We will use Rocket Lab, SpaceX, ULA, and Arianespace as live case studies, because as of April 2026 each of them tells a different and instructive story.
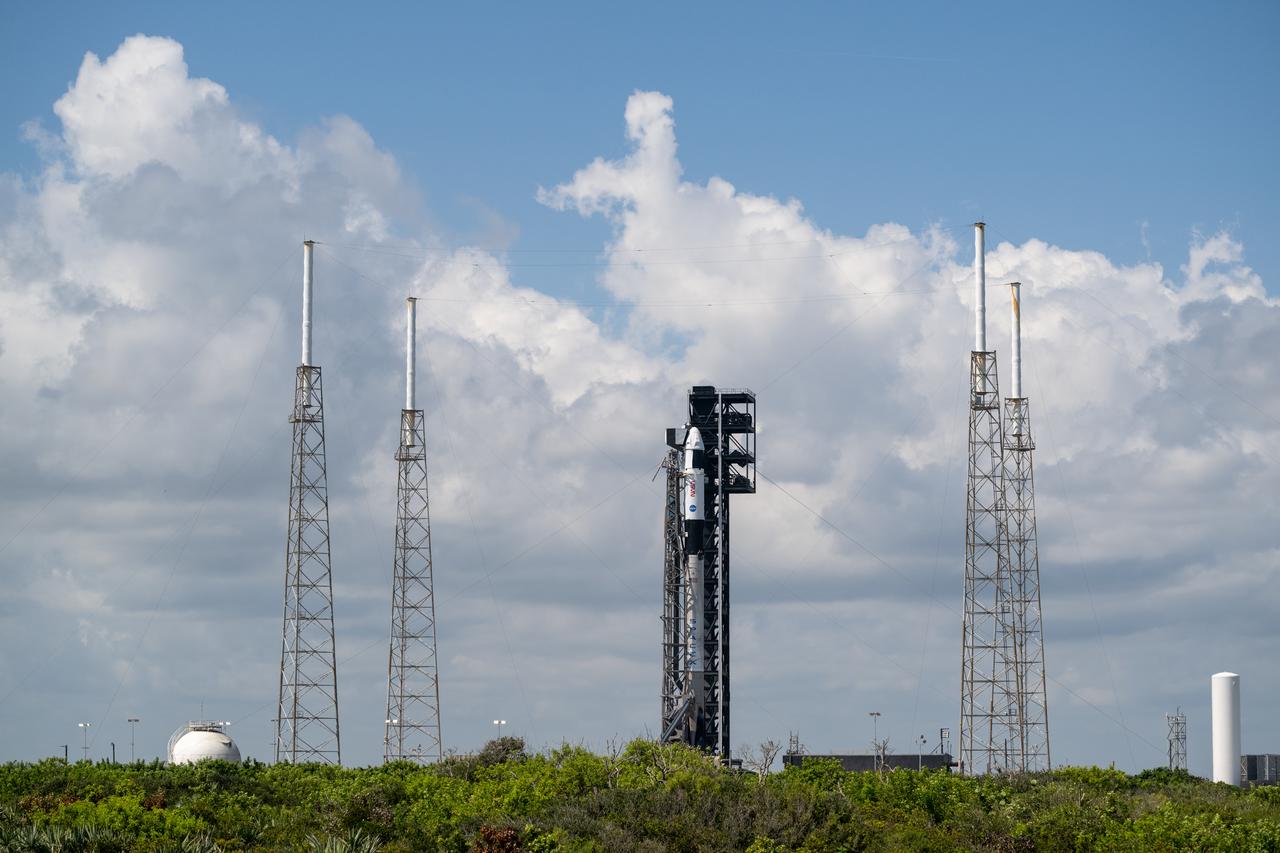
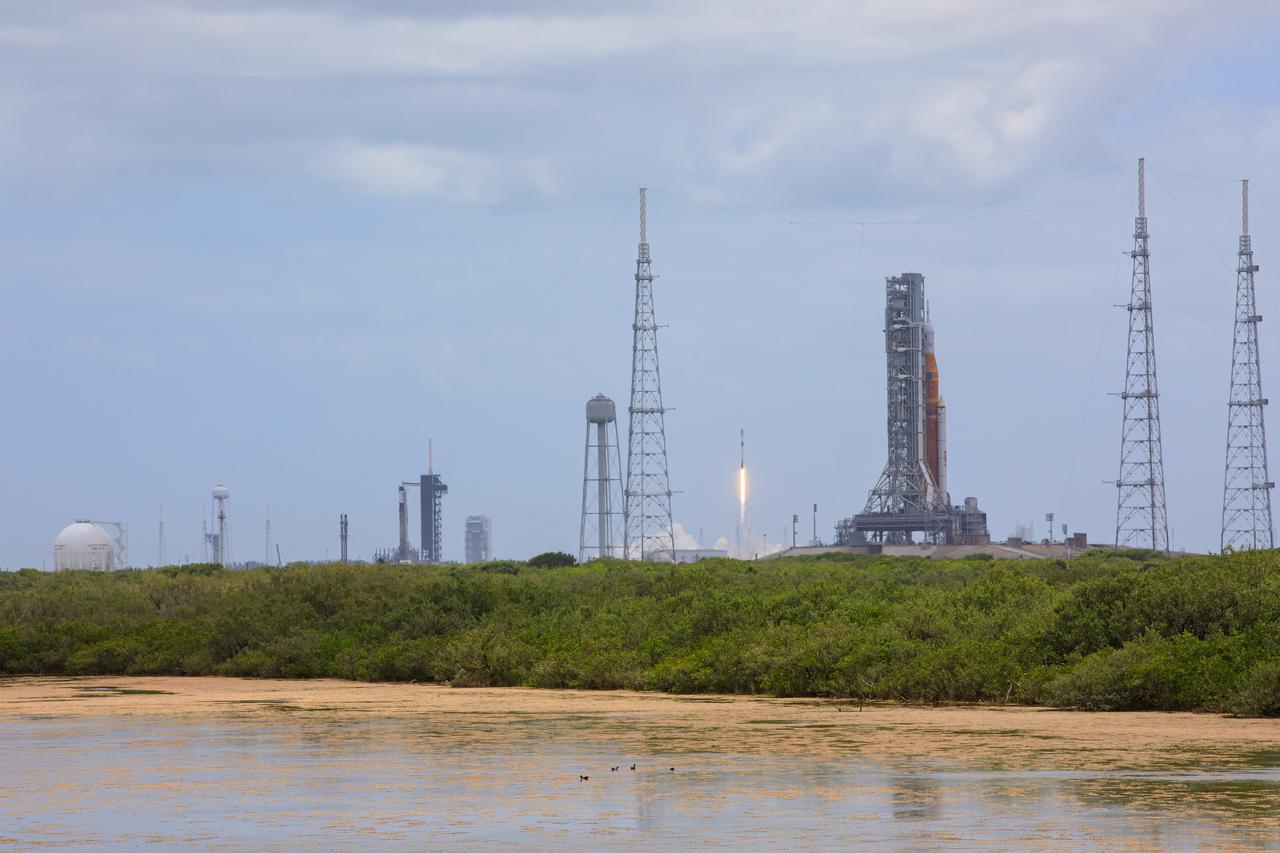 Multiple launch vehicles at Kennedy Space Center. The manifest behind each of these pads contains months of investable intelligence.
Where to Find Manifests and What They Contain

The most comprehensive aggregated manifest is maintained by Spaceflightnow.com at spaceflightnow.com/launch-schedule. It pulls data across providers and updates within hours of schedule changes. For company-specific manifests, you want to go directly to the source:
- SpaceX publishes an official launch schedule at spacex.com/launches, updated continuously. For deeper historical tracking and tail numbers (booster IDs, reuse counts), SpaceXNow and Nextspaceflight maintain crowd-sourced but exceptionally accurate records.
- Rocket Lab does not publish a granular per-mission schedule the way SpaceX does, but their investor relations page includes backlog disclosures with near-term launch commitments, and Spaceflightnow carries their confirmed upcoming missions.
- ULA maintains an official missions page at ulalaunch.com listing contracted upcoming flights. Their backlog is dominated by government contracts with names like USSF-87 and NSSL Phase 2/3 mission designations.
- Arianespace publishes a commercial manifest at arianespace.com with scheduled flights listed by contract holder, rocket variant (Ariane 62 vs. 64), and target orbit.
- Blue Origin (New Glenn) is newer and less transparent, but Spaceflightnow and Nasaspaceflight.com track contracted missions as they are announced.
A complete manifest entry will typically contain: the mission name, the customer, the rocket variant, the target orbit (LEO, MEO, GTO, SSO, TLI), the target launch window, and the launch site. Some entries will carry a customer that is listed only as "classified" or "confidential" — that itself is data, as we will discuss.
The key mental model before you dig in: a launch manifest is not a marketing document. It is a contractual obligation. When a name appears on that list, it represents a signed agreement — and in most cases, a non-refundable deposit. That is why changes to the manifest matter enormously.
Key Metrics to Extract From Any Manifest
Once you have the manifest in front of you, here is what you are solving for:
Launch cadence. Count the missions. How many flights per year is this provider currently running, and how does that compare to stated targets? SpaceX in 2025 flew 165 Falcon 9 missions. In 2026 the company targets 140 to 145 — a deliberate step-back as Starlink-dedicated slots are absorbed by Starship development overhead. For a company like Rocket Lab, where each Electron launch at roughly $8 million is a material revenue event, counting confirmed near-term missions against their guided annual rate tells you a lot about whether the year is front-loaded, back-loaded, or on pace.
Customer concentration. Scan who is paying. For any single provider, you want to understand the ratio of government to commercial customers, and the concentration within each category. A manifest where 60% of flights in the next twelve months are for a single constellation operator is a concentration risk — that customer has enormous negotiating power at renewal, and any satellite program delay on their end directly slips your provider's schedule.
Payload class mix. Is the manifest filling with smallsats, rideshares, or dedicated medium/heavy payloads? This tells you about average revenue per launch. A Falcon 9 flying a single large GEO telecom satellite generates more revenue than a Falcon 9 Transporter rideshare mission (though the latter may carry more payloads total). For Rocket Lab, an Electron flying 15 small satellites for a single defense customer at a negotiated block rate is a very different margin story than a solo commercial mission at list price.
Implied revenue calculation. This is the core of the exercise. Take the number of confirmed launches in the manifest over the next four quarters. Multiply by average selling price. Adjust for any disclosed volume discounts or institutional pricing. What you get is a rough revenue floor — before any unannounced new contracts are signed.
For illustration: if Rocket Lab's Electron carries a list price of approximately $8 million and the manifest shows 22 confirmed launches over the next 12 months, that is approximately $176 million in launch revenue. Rocket Lab's actual launch revenue in recent periods has tracked below this due to government block-buy pricing at discounts of roughly 20 to 30%, which is why cross-referencing the manifest with the investor-disclosed backlog conversion rate (currently guided at approximately 37% of $1.85 billion converting within 12 months) gives you a more grounded number.
Manifest density over time. Look at whether the manifest is fuller or thinner three, six, and twelve months out. A thin manifest six months out is a booking pipeline problem. A dense one twelve months out suggests strong demand visibility. For publicly traded companies, changes in manifest density between quarterly filings are a leading indicator of near-term revenue growth or erosion.
Case Study: Reading Rocket Lab's Manifest (RKLB)

Rocket Lab is the clearest case for manifest-based due diligence among publicly traded launch companies, precisely because the company discloses enough to make the exercise productive without the opacity of a private SpaceX.
 Rocket Lab's Electron launch vehicle at Launch Complex 1, Mahia Peninsula, New Zealand. Electron has now completed more than 60 missions.
As of Q4 2025, Rocket Lab carried a total backlog of $1.85 billion — a 73% year-over-year increase. Critically, 74% of that backlog sits within the Space Systems segment (satellite manufacturing and spacecraft components), with launch services accounting for the remainder. This split matters enormously: it tells you that Rocket Lab is transitioning from a pure-play launch company to a vertically integrated space systems business. The manifest is still critical, but it is now a subset of the full investment thesis.
Within the launch manifest specifically, Rocket Lab sold 28 new Electron launch contracts in Q1 2026 alone — a striking number suggesting the smallsat launch market remains demand-constrained and that Electron's cadence has not yet caught up with bookings. As of early 2026, the company was flying Electron approximately every 11 to 13 days internally, targeting a pace that will exceed 2025's 21 launches.
What the manifest reveals about customer mix: Rocket Lab's Electron customers are increasingly U.S. government and defense-adjacent. The company has manifested Electron flights for the Space Development Agency, NASA, the U.S. Space Force (including four DiskSat satellites launched in late 2025), and national security smallsat programs whose customer names are listed only as "classified" in public schedules. In the most recent quarters, government-adjacent missions have accounted for an estimated 50 to 60% of Electron launches by count. The commercial half is dominated by Earth observation operators and satellite communication startups.
The manifest also previews the Neutron inflection. Rocket Lab has disclosed no specific Neutron customer manifest yet — the vehicle is still in development toward a debut targeted in late 2026, with most industry observers expecting a first flight in 2027. But the absence of Neutron customers from the manifest is not worrying at this stage; it is normal. What you watch for is the first announced Neutron payload contract, because that will be when backlog conversion starts pricing in an $8 million Electron-versus-~$55 million Neutron average revenue shift that will fundamentally change the company's economics.
The HASTE hypersonic testbed program — a modified Electron used for suborbital hypersonic research flights for the U.S. defense apparatus — also appears in Rocket Lab's manifest and merits attention. These are typically government-contracted at prices well above the standard Electron rate. Each HASTE mission is a margin-accretive outlier in the launch revenue line.
SpaceX's Manifest: What a $12 Billion Backlog Actually Means
SpaceX is not publicly traded, but its manifest has profound implications for every company in the launch sector — and for the IPO conversation that dominates the 2026 space investing narrative.
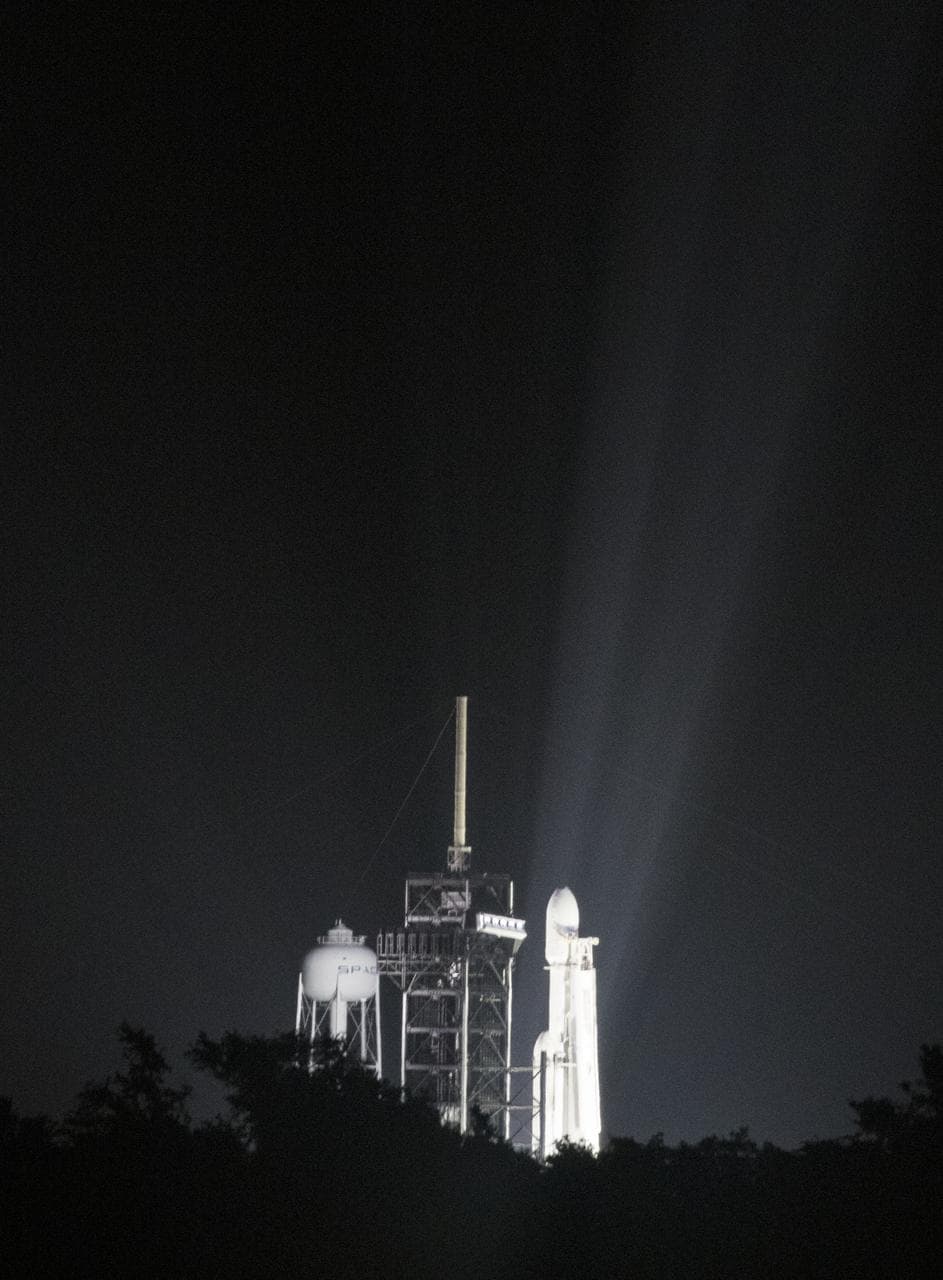
 A Falcon 9 prepares for launch at Cape Canaveral Space Launch Complex 40. SpaceX's manifest currently runs at a sustained pace of 140+ missions annually.
The publicly known portion of SpaceX's backlog is approximately $12 billion in contracted launch services, with the caveat that this figure excludes internal Starlink manifest slots (which are company-owned payloads, not external revenue) and the full scope of U.S. government contracts under NSSL Phase 2 and Phase 3 awards. The manifest-visible external backlog is therefore a floor, not a ceiling.
For 2026, SpaceX's stated target is 140 to 145 Falcon 9 launches. Through mid-April 2026, the company had completed 48 Falcon family launches, roughly on that pace. The manifest composition is roughly:
- Starlink: Internal constellation build-out and replenishment, consuming approximately 50 to 60% of annual Falcon 9 capacity. These are not external revenue missions — they are CapEx, not contracted launch revenue.
- Commercial satellite operators: Amazon Kuiper (contracted on Falcon 9, some on Atlas V), Telesat Lightspeed, government-contracted commercial payloads — roughly 20 to 25% of missions.
- U.S. government / national security: GPS upgrades, classified NRO missions, and ongoing NSSL Phase 2 contracts — roughly 15 to 20% of missions.
- International and rideshare: Transporter rideshare missions, international institutional customers — the remainder.
The manifest-derived investor insight here is about Starship, not Falcon 9. Every Starlink mission that shifts from Falcon 9 to Starship frees up a Falcon 9 slot for external revenue. SpaceX has been explicit that this transition is coming. When you see Starship Starlink missions beginning to appear consistently in the manifest, that is the inflection point where Falcon 9 revenue per-flight economics improve meaningfully — because the company will stop filling its own rocket and start selling capacity to others at $74 million per mission. Watch the manifest, not the press releases.
Pricing Signals: How Manifest Changes Signal Competitive Pressure
The most underappreciated function of the launch manifest as an investor tool is what it reveals about pricing dynamics — specifically, what does not appear on it.
When a launch provider wins a large block-buy contract, the deal typically shows up in their manifest as a cluster of numbered missions over a multi-year period (e.g., "Amazon Kuiper Mission 1 through Mission 18" for Arianespace, or "USSF-67 through USSF-87" for ULA). The existence of these clusters signals pricing confidence — the customer committed to a long-term relationship at a negotiated rate, rather than shopping on a mission-by-mission basis.
Conversely, watch for manifest thinning in the 6 to 12-month forward window. If a provider's manifest shrinks quarter-over-quarter in that near-term window while the industry is generating demand, it suggests one of two things: either the provider is slipping existing missions (a reliability or operations concern) or new customers are booking elsewhere. Both are bearish signals.
 Ariane 6 launching from Kourou. Arianespace competes in a pricing environment where Falcon 9's reusability creates a structural cost floor that fully expendable rockets cannot undercut without institutional subsidy.
Specific pricing signals to watch in 2026:
Arianespace / Ariane 6: The company has locked in a foundational anchor with Amazon Kuiper (18 launches contracted). This cluster dominates their near-to-medium term manifest and provides revenue visibility through approximately 2028. However, Ariane 6 at an estimated $100 to $150 million per launch (Ariane 64 configuration) is competing in a market where Falcon 9 costs $74 million. The Amazon contract was signed partly on strategic European sovereignty grounds, not pure price competition. Watch whether Arianespace is able to add non-Amazon commercial customers to its 2026-2027 manifest. If that window fills only with institutional European missions (ESA programs, French military), it signals that commercial customers are routing to SpaceX on price.
ULA Vulcan Centaur: Vulcan achieved NSSL certification in March 2025 and flew its first national security mission, but the U.S. Space Force paused further NSSL launches in early 2026 following an anomaly. The Vulcan manifest is almost entirely U.S. government — Phase 2 and Phase 3 NSSL missions, GPS III final satellites. This is not a commercial manifest; it is a national security contract execution schedule. The investor signal is not pricing flexibility but program execution risk. A Vulcan anomaly pause means NSSL mission slippage, which at government launch prices (often $200 million or more per mission) is a meaningful revenue timing event for Boeing/ULA's institutional business.
New entrants as pricing pressure indicators: When Blue Origin's New Glenn, Firefly Alpha, or Rocket Lab's Neutron begin appearing in the manifests of commercial customers who previously flew exclusively on Falcon 9, that is the first hard signal of SpaceX pricing power eroding. Until that moment arrives, SpaceX effectively sets the floor, and competing on anything other than reliability or sovereign access is structurally difficult.
Red Flags in Launch Manifests
Learning to read the manifest for what is missing, or what has changed, is as important as reading what is there.
Customer concentration above 40%. If a single customer accounts for more than 40% of a provider's near-term manifest, any slip in that customer's program timeline becomes your provider's revenue problem. Starlink's dominance of SpaceX's own manifest is the most extreme example — but SpaceX is the customer, so the dynamic is different. For third-party providers, heavy single-customer dependence is a risk that is often invisible in earnings calls until a program delay forces a manifest reshuffle.
Mission slippage without replacement. When a mission slips from Q1 to Q3, does an announced replacement fill the slot? If not, you have an empty pad — and an empty pad is unrecoverable revenue. Track month-over-month changes in the Spaceflightnow manifest for your covered companies and note when missions slide without replacement announcements.
"Confidential" customer concentration. One or two classified missions per year is normal for any provider with U.S. government relationships. A manifest that is 30 to 40% "confidential customer" in the commercial segment is a yellow flag — it may indicate the provider is not winning recognizable anchor customers, or that early-stage startup customers do not yet want their constellation development disclosed. Neither is inherently bearish, but it warrants asking questions in earnings Q&A.
Pricing anomalies in rideshare slots. For Falcon 9's Transporter rideshare missions, pricing is publicly listed at approximately $6,000 per kilogram to sun-synchronous orbit. If a company's rideshare manifest begins filling faster while dedicated manifest slots thin, it suggests customers are downgrading payload ambitions or consolidating — a signal about demand health in the smallsat sector.
Manifest versus backlog discrepancy. Publicly traded companies report contracted backlog in their quarterly filings. If the manifest (flight count × average price) implies materially less than the disclosed backlog, investigate. Either the backlog includes long-duration contracts not yet scheduled, volume options not yet exercised, or space systems contracts rather than pure launch. All of these are benign explanations — but an unexplained gap between manifest-implied revenue and reported backlog is worth flagging.
Making Manifest Reading Part of Your Due Diligence
The launch manifest is not a replacement for earnings analysis, management commentary, or technical due diligence on rocket development programs. It is a complement to all of those — a data layer that updates more frequently than earnings quarters and carries fewer interpretation filters than investor relations messaging.
A practical workflow: bookmark Spaceflightnow's launch schedule and check it the week before any quarterly earnings call for a company in your portfolio. Count the mission changes since the previous quarter. Look for slips, additions, and new customer names. Then listen to the earnings call and management's commentary on cadence, backlog, and customer additions through that lens. You will find that the manifest told you most of the story before the call started.
For Rocket Lab specifically, combining the manifest with the company's disclosed backlog conversion guidance (approximately 37% of $1.85 billion within 12 months) gives you an independent cross-check on near-term revenue pacing. If the manifest is ahead of that conversion rate, management may revise upward. If the manifest is thin relative to guided conversion, expect either a booking surge announcement or a quiet guidance revision.
The broader principle applies across the sector: launch is an industry where contractual commitments precede revenue recognition by months to years. The manifest is where those commitments live. Most investors are looking at the earnings report — the lag indicator. A small minority are reading the manifest — the leading one.
That asymmetry is precisely why it is worth your time.
Sources: Spaceflightnow Launch Schedule, Rocket Lab Q4 2025 Investor Presentation, ULA NSSL Phase 2/3 contract disclosures, Arianespace commercial manifest, SpaceXNow flight statistics, Breaking Defense (Vulcan pause reporting), Benzinga/Space launch capacity analysis, Motley Fool RKLB analysis April 2026.

