Ranked by total program cost in inflation-adjusted 2025 U.S. dollars, the Apollo program ($280 billion), the Space Shuttle program ($240 billion), the International Space Station ($150 billion lifetime to date), the SLS+Orion program ($50+ billion through Artemis IV), and the James Webb Space Telescope ($10.0 billion lifecycle) lead the list. Below is a full top 10. Be careful with these numbers — "program cost" includes development, vehicles, ground infrastructure, and operations; "mission cost" usually means just one flight. Mixing those two definitions is the most common cost-comparison error in space media.
Comparison Summary Table
| Rank | Mission / Program | Operator | Years | Cost (Then-Year USD) | Cost (2025 USD, Inflation-Adjusted) | Cost Type |
|---|---|---|---|---|---|---|
| 1 | Apollo program | NASA | 1960–1973 | $25.8B | ~$280B | Program (Saturn rockets, CSM, LM, ground, ops) |
| 2 | Space Shuttle program | NASA | 1972–2011 | $113.7B | ~$240B | Program (development + 135 flights) |
| 3 | International Space Station (U.S. share + partners, lifetime to 2025) | NASA / Roscosmos / ESA / JAXA / CSA | 1998–present | ~$100B+ U.S., ~$150B+ all partners | ~$150B+ | Program (build + 25 years operations) |
| 4 | SLS + Orion program (through Artemis IV) | NASA | 2011–present | ~$50B obligated | ~$50B+ | Program (development + first 4 vehicles) |
| 5 | James Webb Space Telescope | NASA / ESA / CSA | 1996–present | $10.0B U.S. (+ ESA/CSA contributions) | ~$10–11B | Program (development + 5-year operations) |
| 6 | Hubble Space Telescope (lifetime, including 5 servicing missions) | NASA / ESA | 1977–present | ~$13.5B then-year through 2024 | ~$16B | Program (development + servicing + ops) |
| 7 | Cassini–Huygens | NASA / ESA / ASI | 1989–2017 | $3.27B U.S. + $660M ESA/ASI | ~$5–6B | Program |
| 8 | Perseverance / Mars 2020 | NASA | 2013–present | $2.7B | ~$3.0B | Mission (development + landing + first 2 years ops) |
| 9 | Curiosity / Mars Science Laboratory | NASA | 2004–present | $2.5B | ~$3.4B | Mission (development + landing + 2 years ops) |
| 10 | Galileo (Jupiter orbiter) | NASA / ESA | 1977–2003 | $1.4B U.S. + $200M ESA | ~$3.0B | Mission |
Inflation adjustments use the U.S. Bureau of Labor Statistics CPI, except where NASA-specific budget deflators apply (most program-cost numbers cited here are NASA's own inflation-adjusted figures from CBO and OIG reports).
1. Apollo Program — ~$280 Billion (2025 USD)
Then-year cost: $25.8B over 1960–1973. Lunar landings: 6 (Apollo 11, 12, 14, 15, 16, 17).
The Apollo program is the most expensive crewed space program in history by a wide margin. The official NASA budget figure of $25.4 billion (then-year) covers the Saturn rocket development, the Command/Service Module, the Lunar Module, ground infrastructure (Kennedy Space Center pads, Mission Control, Manned Spacecraft Center), and 11 crewed flights including Apollo 1 (which never flew due to the 1967 fire) and the cancelled Apollos 18–20.
Inflation-adjusted to 2025 USD, the figure is approximately $280 billion — though estimates range from $260B to $300B depending on the deflator used. NASA's own historical estimate (from a 2023 Office of Inspector General audit) places the inflation-adjusted figure at the higher end of this range.
By way of comparison: the entire Manhattan Project cost about $30 billion in 2025 USD. Apollo cost roughly nine Manhattan Projects. (NASA Apollo Cost)
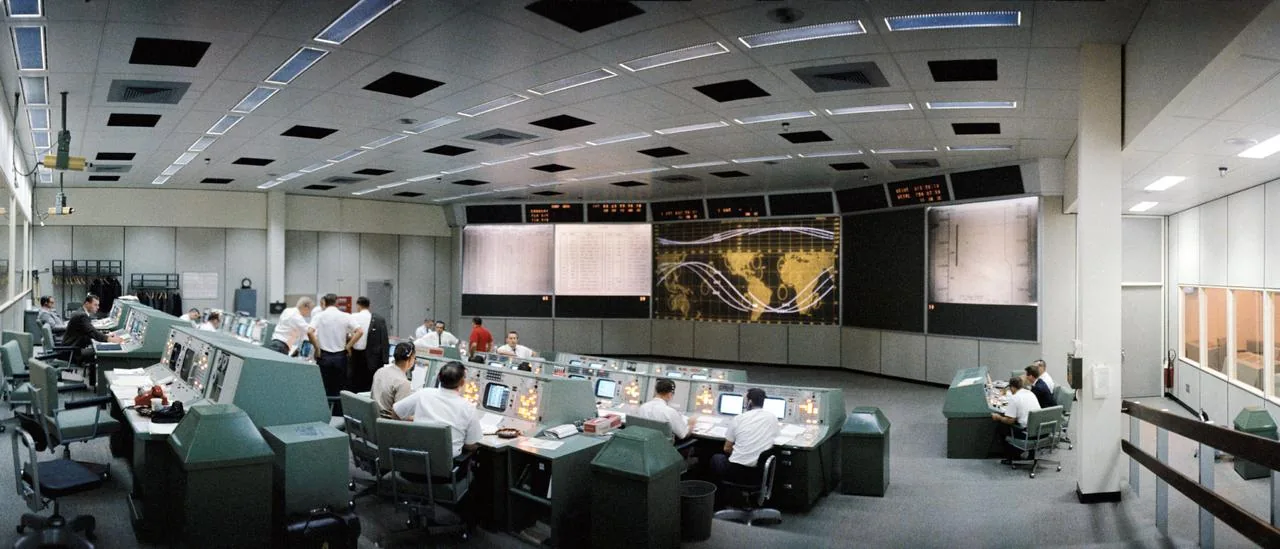
2. Space Shuttle Program — ~$240 Billion (2025 USD)
Then-year cost: $113.7B over 1972–2011. Total flights: 135.
The Space Shuttle program ran from initial development (1972) through final flight (STS-135, July 2011). Total then-year program cost was approximately $113.7 billion, including development of the Orbiter, External Tank, Solid Rocket Boosters, the Space Shuttle Main Engines, ground infrastructure modifications, and operations costs across 135 missions.
Inflation-adjusted to 2025 USD, the program total is approximately $240 billion. Per-flight cost averaged about $450M (then-year) — but on a fully amortized basis (program cost divided by flights), each Shuttle launch represented roughly $1.5 billion. The two losses (Challenger 1986, Columbia 2003) added immense human cost and contributed to extended grounding periods that increased fixed costs.
NASA's Space Shuttle Final Report (2011) is the canonical reference. (NASA Shuttle)
3. International Space Station — ~$150 Billion+ (2025 USD)
Then-year cost: ~$100B+ (U.S. share). Total construction + operations 1998–present.
The ISS is the most expensive single object ever built. Estimates of total program cost range widely depending on how partner contributions are counted, what fraction of Space Shuttle assembly flights are attributed to ISS, and what scope of operations is included.
The most-cited figure is $100 billion U.S. share through approximately 2010 — counting U.S. modules, the U.S. share of operations, and Shuttle assembly flights. Adding partner contributions (Roscosmos, ESA, JAXA, CSA) and continuing operations from 2010 to 2025 brings the total to approximately $150 billion in 2025 USD. NASA's annual ISS operations budget alone is roughly $3 billion.
The U.S. Deorbit Vehicle contract awarded to SpaceX in 2024 ($843 million) will eventually add to this total, plus continued operations through ~2030. (NASA ISS Budget)
4. SLS + Orion Program — ~$50B+ (2025 USD)
Obligated through 2025: ~$50B. Vehicles flown: 2 (Artemis I, Artemis II).
The Space Launch System and Orion crew vehicle programs have together obligated more than $50 billion in then-year dollars from program inception (~2011 for SLS, earlier for Orion through Constellation) through 2025. This includes development, manufacturing, ground systems (the Mobile Launcher tower modifications), and the first four flight vehicles.
The NASA Office of Inspector General's 2023 audit estimated the SLS Block 1 per-flight cost at approximately $2.2 billion (excluding Orion at ~$1 billion per flight) when fully amortized. Artemis II flew successfully in April 2026. Artemis IV (the Moon landing) will use Block 1B, which adds the Exploration Upper Stage at additional cost.
These are program-cost figures, not just per-flight amortization, and they will continue to grow with each Artemis mission. (NASA OIG Reports)
5. James Webb Space Telescope — ~$10–11 Billion (2025 USD)
Then-year cost: $10.0B U.S. (1996–2027 ops). ESA + CSA contributions add ~$700M.
JWST's total NASA lifecycle cost was officially confirmed at $9.7B at launch (December 2021) and is expected to reach ~$10.0B through the prime mission. ESA contributed the Ariane 5 launch and the NIRSpec instrument; CSA contributed the FGS/NIRISS instrument. Total combined contributions are approximately $10.7B in 2025 USD.
JWST overran its original $1.6B (2002) budget by approximately 6×. The program survived multiple cancellation attempts in Congress, most notably in 2011. The science return — including the Top 10 deepest space photos discussed in our companion article — has so far justified the cost in the eyes of the astronomy community.
NASA's JWST mission page and the 2018 GAO report on JWST cost are the standard references. (NASA JWST)
6. Hubble Space Telescope — ~$16 Billion Lifetime (2025 USD)
Then-year cost: ~$13.5B through 2024 (development + 5 servicing + ops). Operating since 1990.
Hubble's original development cost (1977–1990) was approximately $1.5B in then-year dollars. Add five Space Shuttle servicing missions (1993, 1997, 1999, 2002, 2009), which were major Shuttle missions in their own right, and continuous ground operations from 1990 through 2025, and total lifetime cost is approximately $13.5B then-year, or roughly $16 billion in 2025 USD.
Servicing Mission 4 (2009) alone cost approximately $1.1 billion. Hubble's per-year operations cost is approximately $98 million. NASA continues to evaluate possible private servicing missions to extend its life past current single-gyro operations.
This makes Hubble the most expensive space telescope program if you count cumulative lifetime cost — though JWST's higher upfront price tag remains the more-cited figure. (NASA Hubble)
7. Cassini–Huygens — ~$5–6 Billion (2025 USD)
Then-year cost: $3.27B NASA + $660M ESA/ASI = $3.93B total.
Cassini–Huygens was the most expensive interplanetary mission ever flown. Total cost across NASA, ESA (which provided the Huygens probe), and the Italian Space Agency (which provided the high-gain antenna and several instruments) was approximately $3.93B in then-year dollars. Inflation-adjusted to 2025, the total reaches roughly $5–6 billion.
The mission ran for 19.9 years from launch (1997) through Grand Finale (2017), making it one of the highest-value-per-dollar missions on this list as well — a single mission that imaged Saturn's rings at unprecedented detail, dropped a probe on Titan, and discovered the active Enceladus geysers.
NASA's Cassini archive and ESA's Huygens project documentation are the references. (NASA Cassini)
8. Mars 2020 / Perseverance — ~$3.0 Billion (2025 USD)
Then-year cost: $2.7B (development + launch + 2 years operations).
Mars 2020 / Perseverance launched July 2020 and landed on Mars February 2021. Mission cost through 2023 was approximately $2.7 billion in then-year dollars. The mission's caching of rock samples for future return to Earth is the key science driver — the eventual Mars Sample Return campaign would add many additional billions.
Perseverance's Ingenuity helicopter (2021–2024) was a separate sub-program with its own approximately $85M cost. Ingenuity completed 72 flights before its rotor blades were damaged in January 2024.
JPL's Mars 2020 mission page is the cost reference. (NASA Mars 2020)
9. Curiosity / Mars Science Laboratory — ~$3.4 Billion (2025 USD)
Then-year cost: $2.5B (development + launch + 2 years operations).
Curiosity launched November 2011 and landed on Mars in August 2012. The mission's then-year total of $2.5 billion was approximately 30% over its initial budget, primarily due to delays from the original 2009 launch window. The "sky crane" landing system was the most complex Mars EDL (entry, descent, and landing) architecture ever flown.
Curiosity continues to operate in 2026 and has driven more than 33 km on Mars, far exceeding its 2-year primary mission goal. Per-year operations cost is approximately $50–60M.
NASA's MSL page is the cost reference. (NASA Curiosity)
10. Galileo Jupiter Orbiter — ~$3.0 Billion (2025 USD)
Then-year cost: $1.4B U.S. + $200M ESA = ~$1.6B total. Operations 1989–2003.
Galileo launched on STS-34 (Atlantis) in October 1989 and arrived at Jupiter in December 1995, spending 8 years orbiting the planet and its moons. Total NASA cost was approximately $1.4 billion then-year, plus ESA contributions for the German-built propulsion module and other components.
Galileo's discoveries included the first direct evidence for a subsurface ocean on Europa, detailed mapping of Io's volcanism, and atmospheric data from a probe that descended into Jupiter (December 1995). The mission was deliberately deorbited into Jupiter in September 2003 to prevent contamination of Europa.
NASA's Galileo legacy archive holds the mission record. (NASA Galileo)
Methodology / How We Ranked
We ranked by total inflation-adjusted program cost in 2025 U.S. dollars. We used:
- NASA Office of Inspector General audits where available (most authoritative for U.S. costs).
- Government Accountability Office (GAO) reports for major programs (JWST, SLS).
- ESA and JAXA published budget figures for partner contributions.
- BLS CPI inflation deflators for then-year-to-2025-USD adjustments.
We distinguish carefully between:
- Program cost: total spending across development, ground systems, multiple flight vehicles, and operations (Apollo, Shuttle, ISS, SLS+Orion).
- Mission cost: spending for one specific flight including its development, launch, and primary operations (Cassini, Curiosity, Perseverance, Galileo, JWST).
- Lifetime cost: cumulative spending from inception through current year, including ongoing ops (Hubble, ISS).
This is why JWST ($10B mission) ranks below Apollo ($280B program) — they're different categories of spending. The table notes which type each entry uses.
We excluded:
- Classified national-security space programs where total cost is not publicly disclosed.
- Multi-decade satellite-constellation costs (Landsat, GPS, NRO assets) where the boundary of "the mission" is ambiguous.
- Soviet/Russian programs where ruble-to-dollar conversion is highly uncertain.
FAQ
Was Apollo really almost twice as expensive as the Space Shuttle program? In inflation-adjusted dollars, yes. Apollo concentrated more spending in a shorter period (13 years vs. Shuttle's 39 years). The annual peak NASA budget during Apollo was over 4% of the federal budget; today it is about 0.5%.
Why is JWST so much cheaper than Hubble? JWST is cheaper than Hubble's lifetime cost (which includes 5 servicing missions over 35 years). JWST's $10B is roughly the cost of Hubble's original 1990 launch plus the first three servicing missions in 2025 dollars.
Are these costs adjusted for inflation properly? For the major programs (Apollo, Shuttle, ISS) we use NASA's own published inflation-adjusted figures, which are sometimes higher than what the BLS CPI alone would give because they account for aerospace-specific cost growth (the so-called "NASA New Start Index"). For mission-cost entries we use a simple CPI deflator.
How does ISS compare to a Mars program? NASA's official cost estimate for a crewed Mars mission (per various 2010s and 2020s studies) is approximately $200–500 billion in today's dollars — comparable to or higher than ISS lifetime. The wide range reflects how differently architected such a mission could be.
What about commercial space? SpaceX, Blue Origin, and Rocket Lab are private companies whose total program spending is not publicly disclosed in the same way as government missions. SpaceX's Starship program is widely estimated at $5–10 billion of internal investment to date — roughly comparable to JWST's NASA cost.
Is the Apollo cost figure inflated for political reasons? The most-cited figure ($25.4B then-year) is NASA's own contemporary accounting and is widely accepted. The 2025-dollar figure ranges from $250B to $300B depending on which deflator is used; we use $280B as a midpoint.
Sources
- NASA Apollo program budget history: https://www.nasa.gov/history/apollo-program-budget-and-history/
- NASA Space Shuttle Final Report (2011): https://www.nasa.gov/specials/30-years-shuttle/
- NASA International Space Station: https://www.nasa.gov/international-space-station/
- NASA Office of Inspector General audits: https://oig.nasa.gov/audits.html
- NASA JWST mission: https://www.nasa.gov/mission/webb/
- NASA Hubble: https://www.nasa.gov/mission/hubble/
- NASA Cassini: https://solarsystem.nasa.gov/missions/cassini/overview/
- NASA Mars 2020 / Perseverance: https://mars.nasa.gov/mars2020/
- NASA MSL / Curiosity: https://mars.nasa.gov/msl/
- NASA Galileo: https://solarsystem.nasa.gov/missions/galileo/overview/
- ESA budget data: https://www.esa.int/About_Us/Corporate_news/Funding
- U.S. Bureau of Labor Statistics CPI inflation calculator: https://www.bls.gov/data/inflation_calculator.htm